In this blog post, we will explore the concepts of frequency distribution and percentage frequency distribution, essential tools in statistical analysis. These methods help in organizing and visualizing data, making it easier to identify patterns and trends. By the end of this post, you'll have a clear understanding of how to apply these techniques to your datasets. Additionally, we'll provide links to JoVE.com, which offers comprehensive visual resources to further enhance your grasp of these concepts.
What is Frequency Distribution and Percentage?
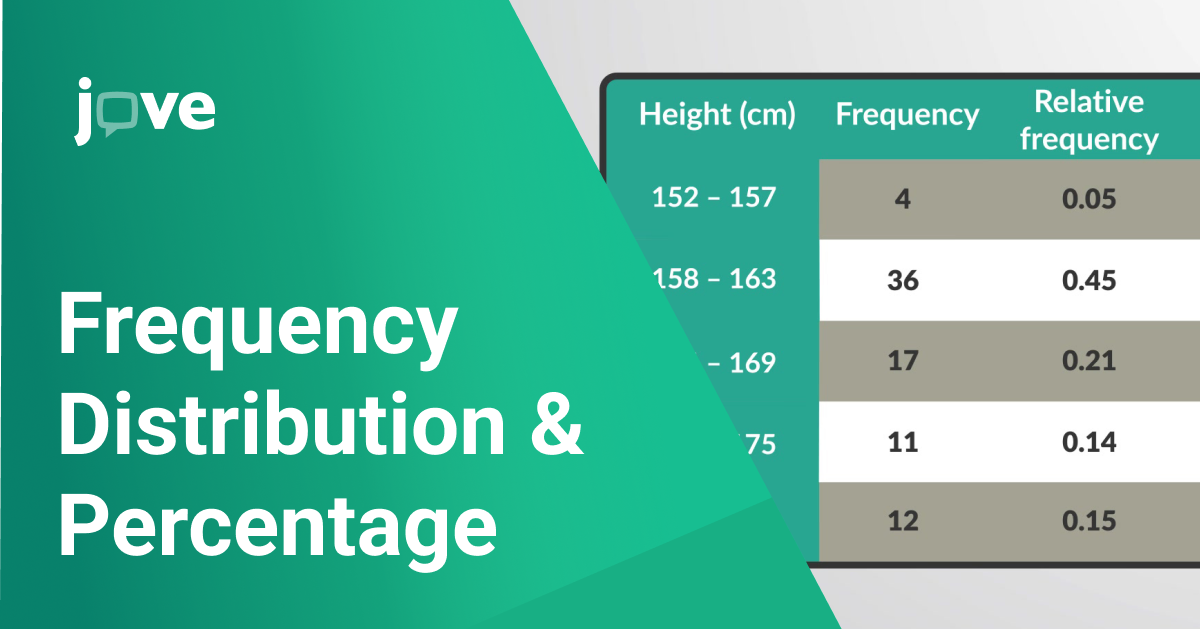
Frequency distribution is a way to show how often each value appears in a dataset. It involves counting each value and organizing these counts into a table or chart, making it easier to see how the data is spread out. Percentage frequency distribution takes this a step further by showing these counts as percentages of the total number of observations. This means converting the counts into percentages, which makes it easier to compare different groups within the data. This method is very useful in statistics for understanding large or complex datasets and spotting patterns and trends.
What are some benefits of using graphs of frequency distribution?
Creating a frequency distribution table is a fundamental step in organizing and analyzing data sets, allowing researchers to understand the distribution of values within a dataset. For instance, using a frequency distribution table calculator can streamline the process, making it easier to compile and interpret data efficiently.In addition to manually constructing frequency distribution tables, tools like Excel can be utilized to create detailed frequency distributions and graphs. These techniques are essential for effective data analysis.
- Gathering and Organizing Data:The first step in creating a percentage frequency distribution is to collect and organize the data. This involves identifying the total number of observations and sorting these observations into distinct categories or groups. Each category is then counted to determine how many times each specific value appears.
-
Calculating Percentages:Once the data is organized, the next step is to calculate the percentage for each category. This is done by dividing the number of occurrences in each category by the total number of observations and then multiplying by 100 to get the percentage. This conversion standardizes the data, allowing for straightforward comparisons across different groups.
-
Visual Representation: After calculating the percentages, the data can be visualized using bar graphs, pie charts, or tables. These visual aids help illustrate the percentage frequency distribution clearly, showing the relative frequency of each category within the dataset. Visualizations make it easier to identify trends, patterns, and outliers in the data.
Educational Benefits of Learning with Jove Core Statistics
Learning with JoVE Core Statistics provides interactive video content that enhances comprehension of complex statistical concepts and practical applications. This visual and practical approach helps students grasp and retain essential knowledge more effectively.
Interactive Learning Experience
Jove Core Statistics takes learning to the next level by offering interactive tools and simulations. These resources allow students to manipulate data and observe how changes affect percentage frequency distributions in real-time. This hands-on approach not only makes learning more engaging but also enhances understanding by allowing learners to see the immediate impact of theoretical concepts applied practically.
Practical Applications and Case Studies
Understanding percentage frequency distributions is crucial across various fields such as marketing, economics, and public policy. Jove Core Statistics incorporates case studies and examples from these areas to show how percentage frequency distribution is applied in real-world scenarios. These applications demonstrate the relevance of statistical knowledge and encourage learners to apply their learning in practical settings.
Conclusion
This blog post provides a comprehensive guide to understanding and utilizing percentage frequency distribution with the help of Jove Core Statistics. By integrating theoretical knowledge with practical tools and real-world applications, Jove makes learning statistics accessible and applicable to everyday situations, preparing learners for both academic success and professional excellence.